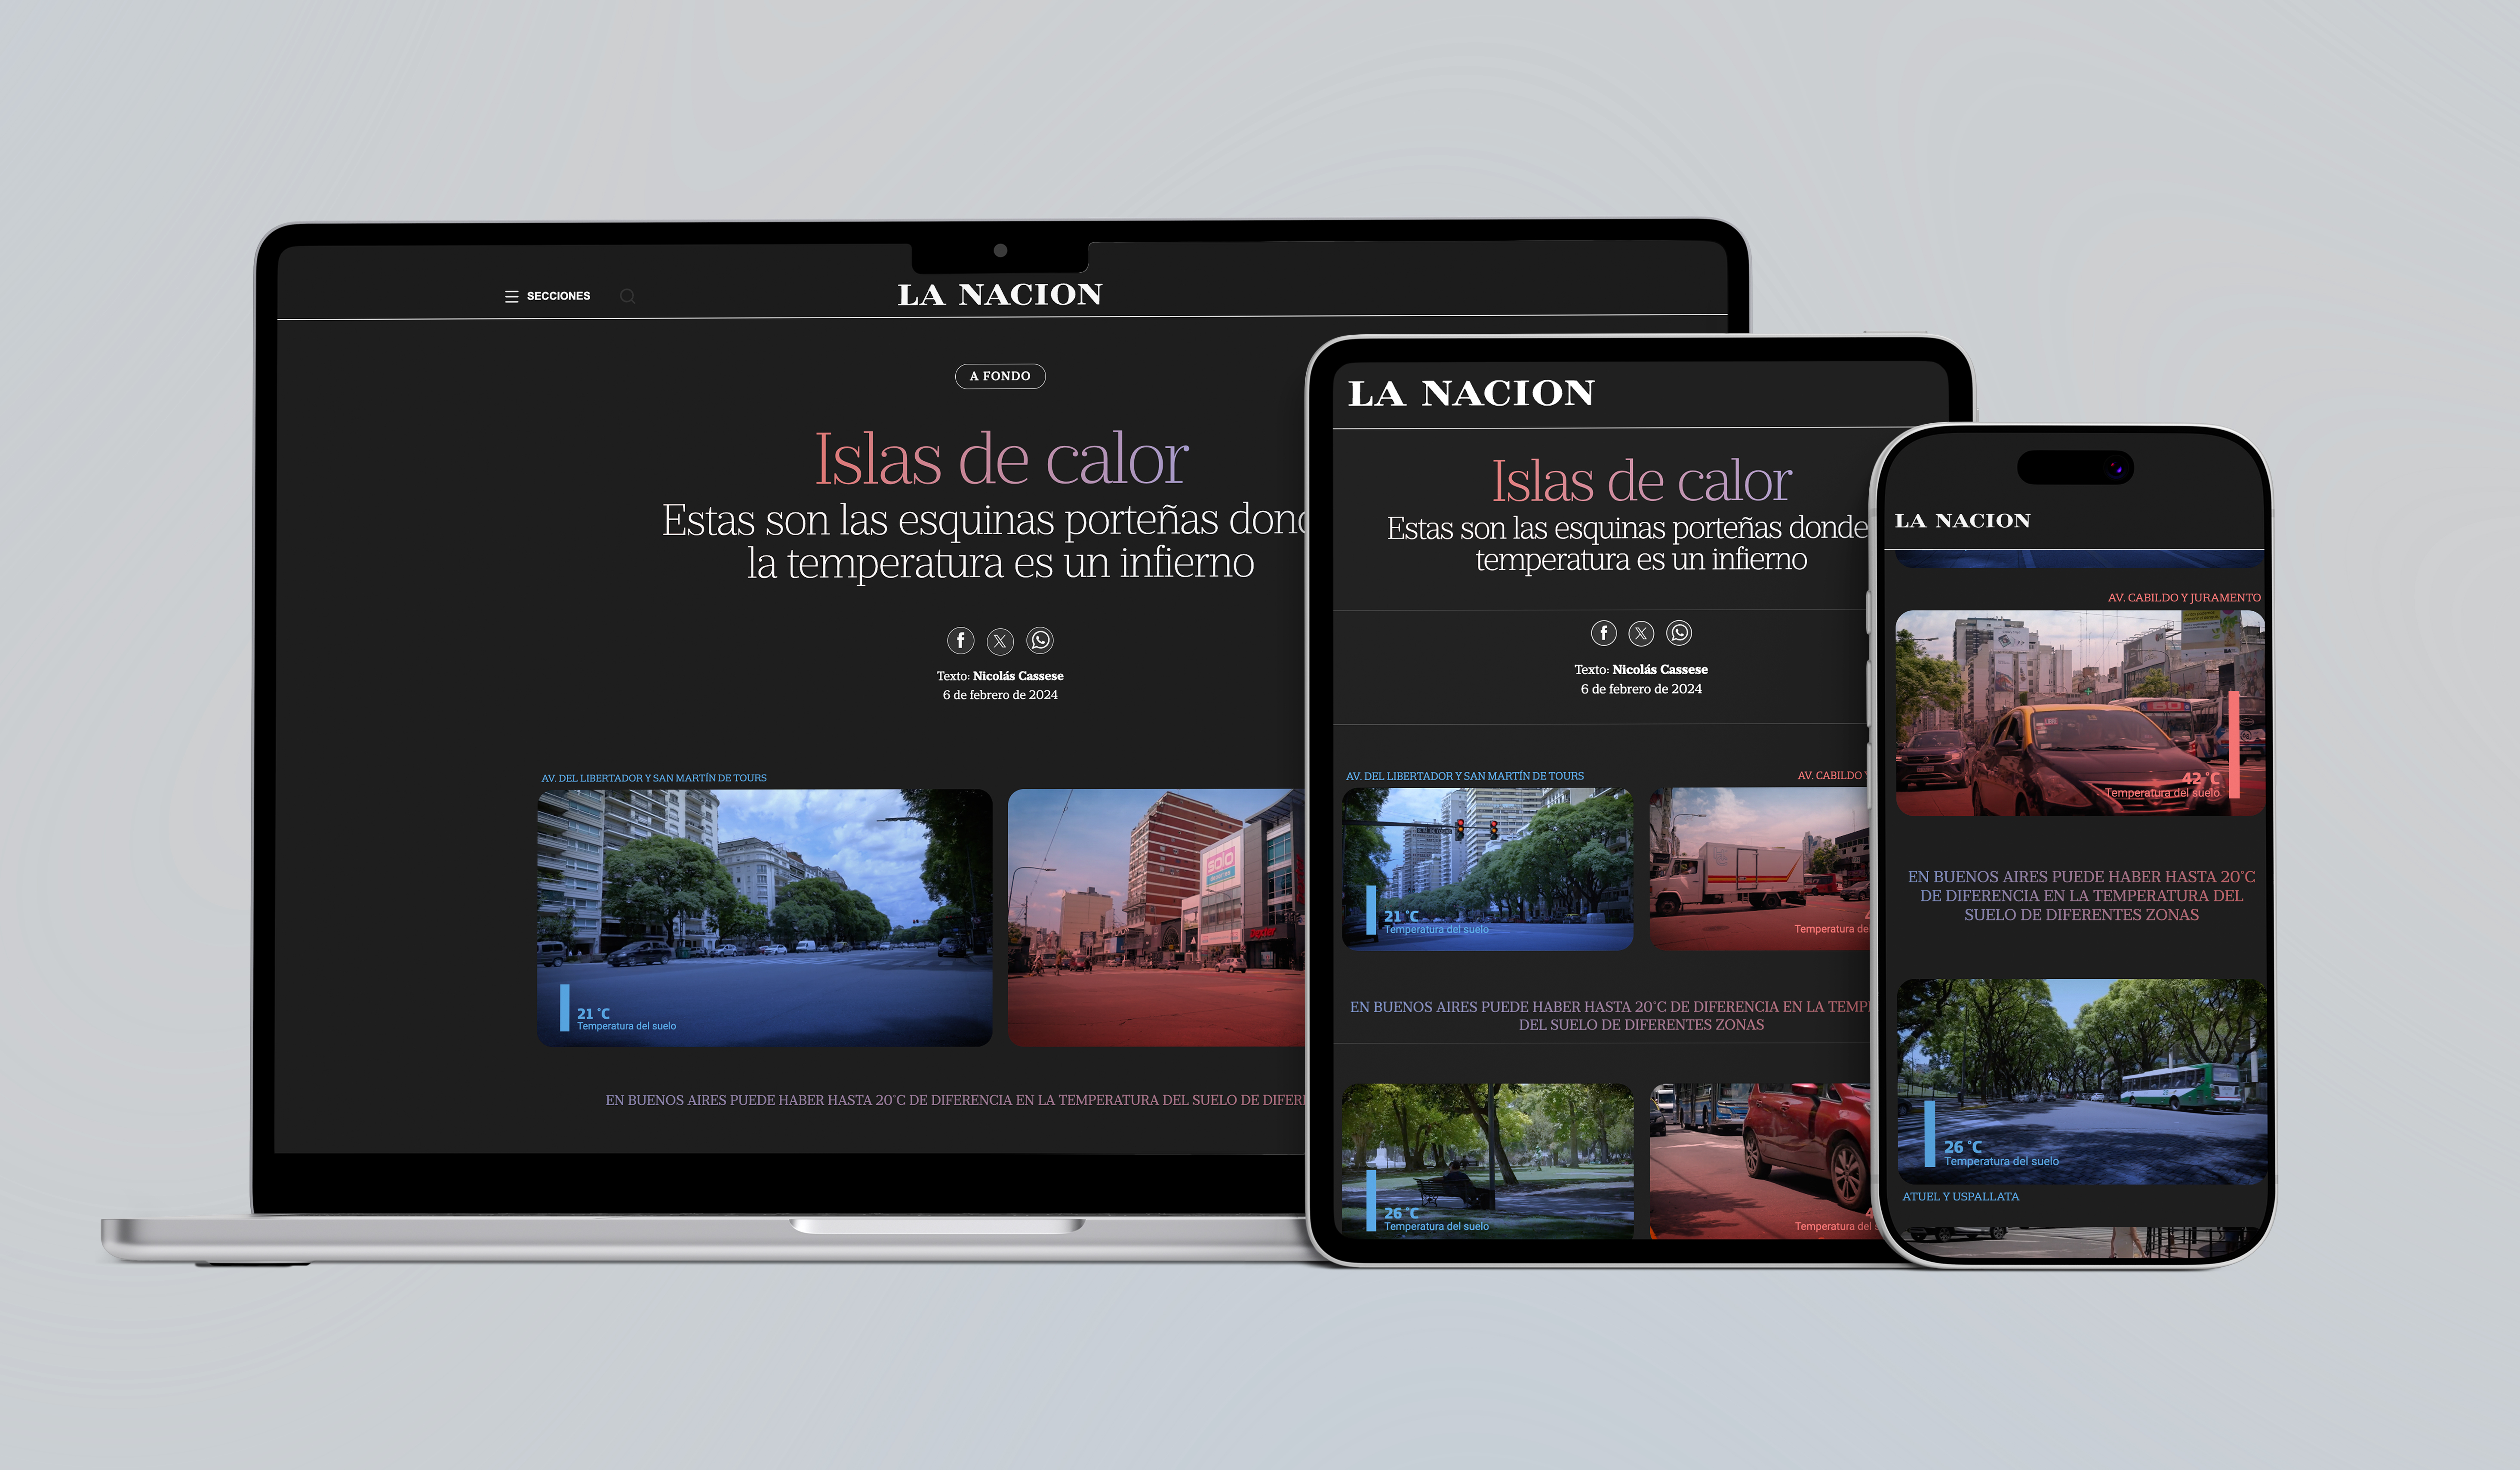
Heat Islands
An article about the impact of climate change in cities
Co-Authors
- La Nación's Visual, Data and Video Teams
Year
2022
Urban Heat Islands: The Corners in Buenos Aires where Temperature is Hell is an interactive visual story piece published by La Nación that investigates how climate change and urban planning drive extreme ground temperatures across Buenos Aires. Combining satellite analysis with street-level mapping, the project lets readers explore temperature disparities in their own neighborhoods while discovering the health impacts and potential urban solutions to this phenomenon.
Context
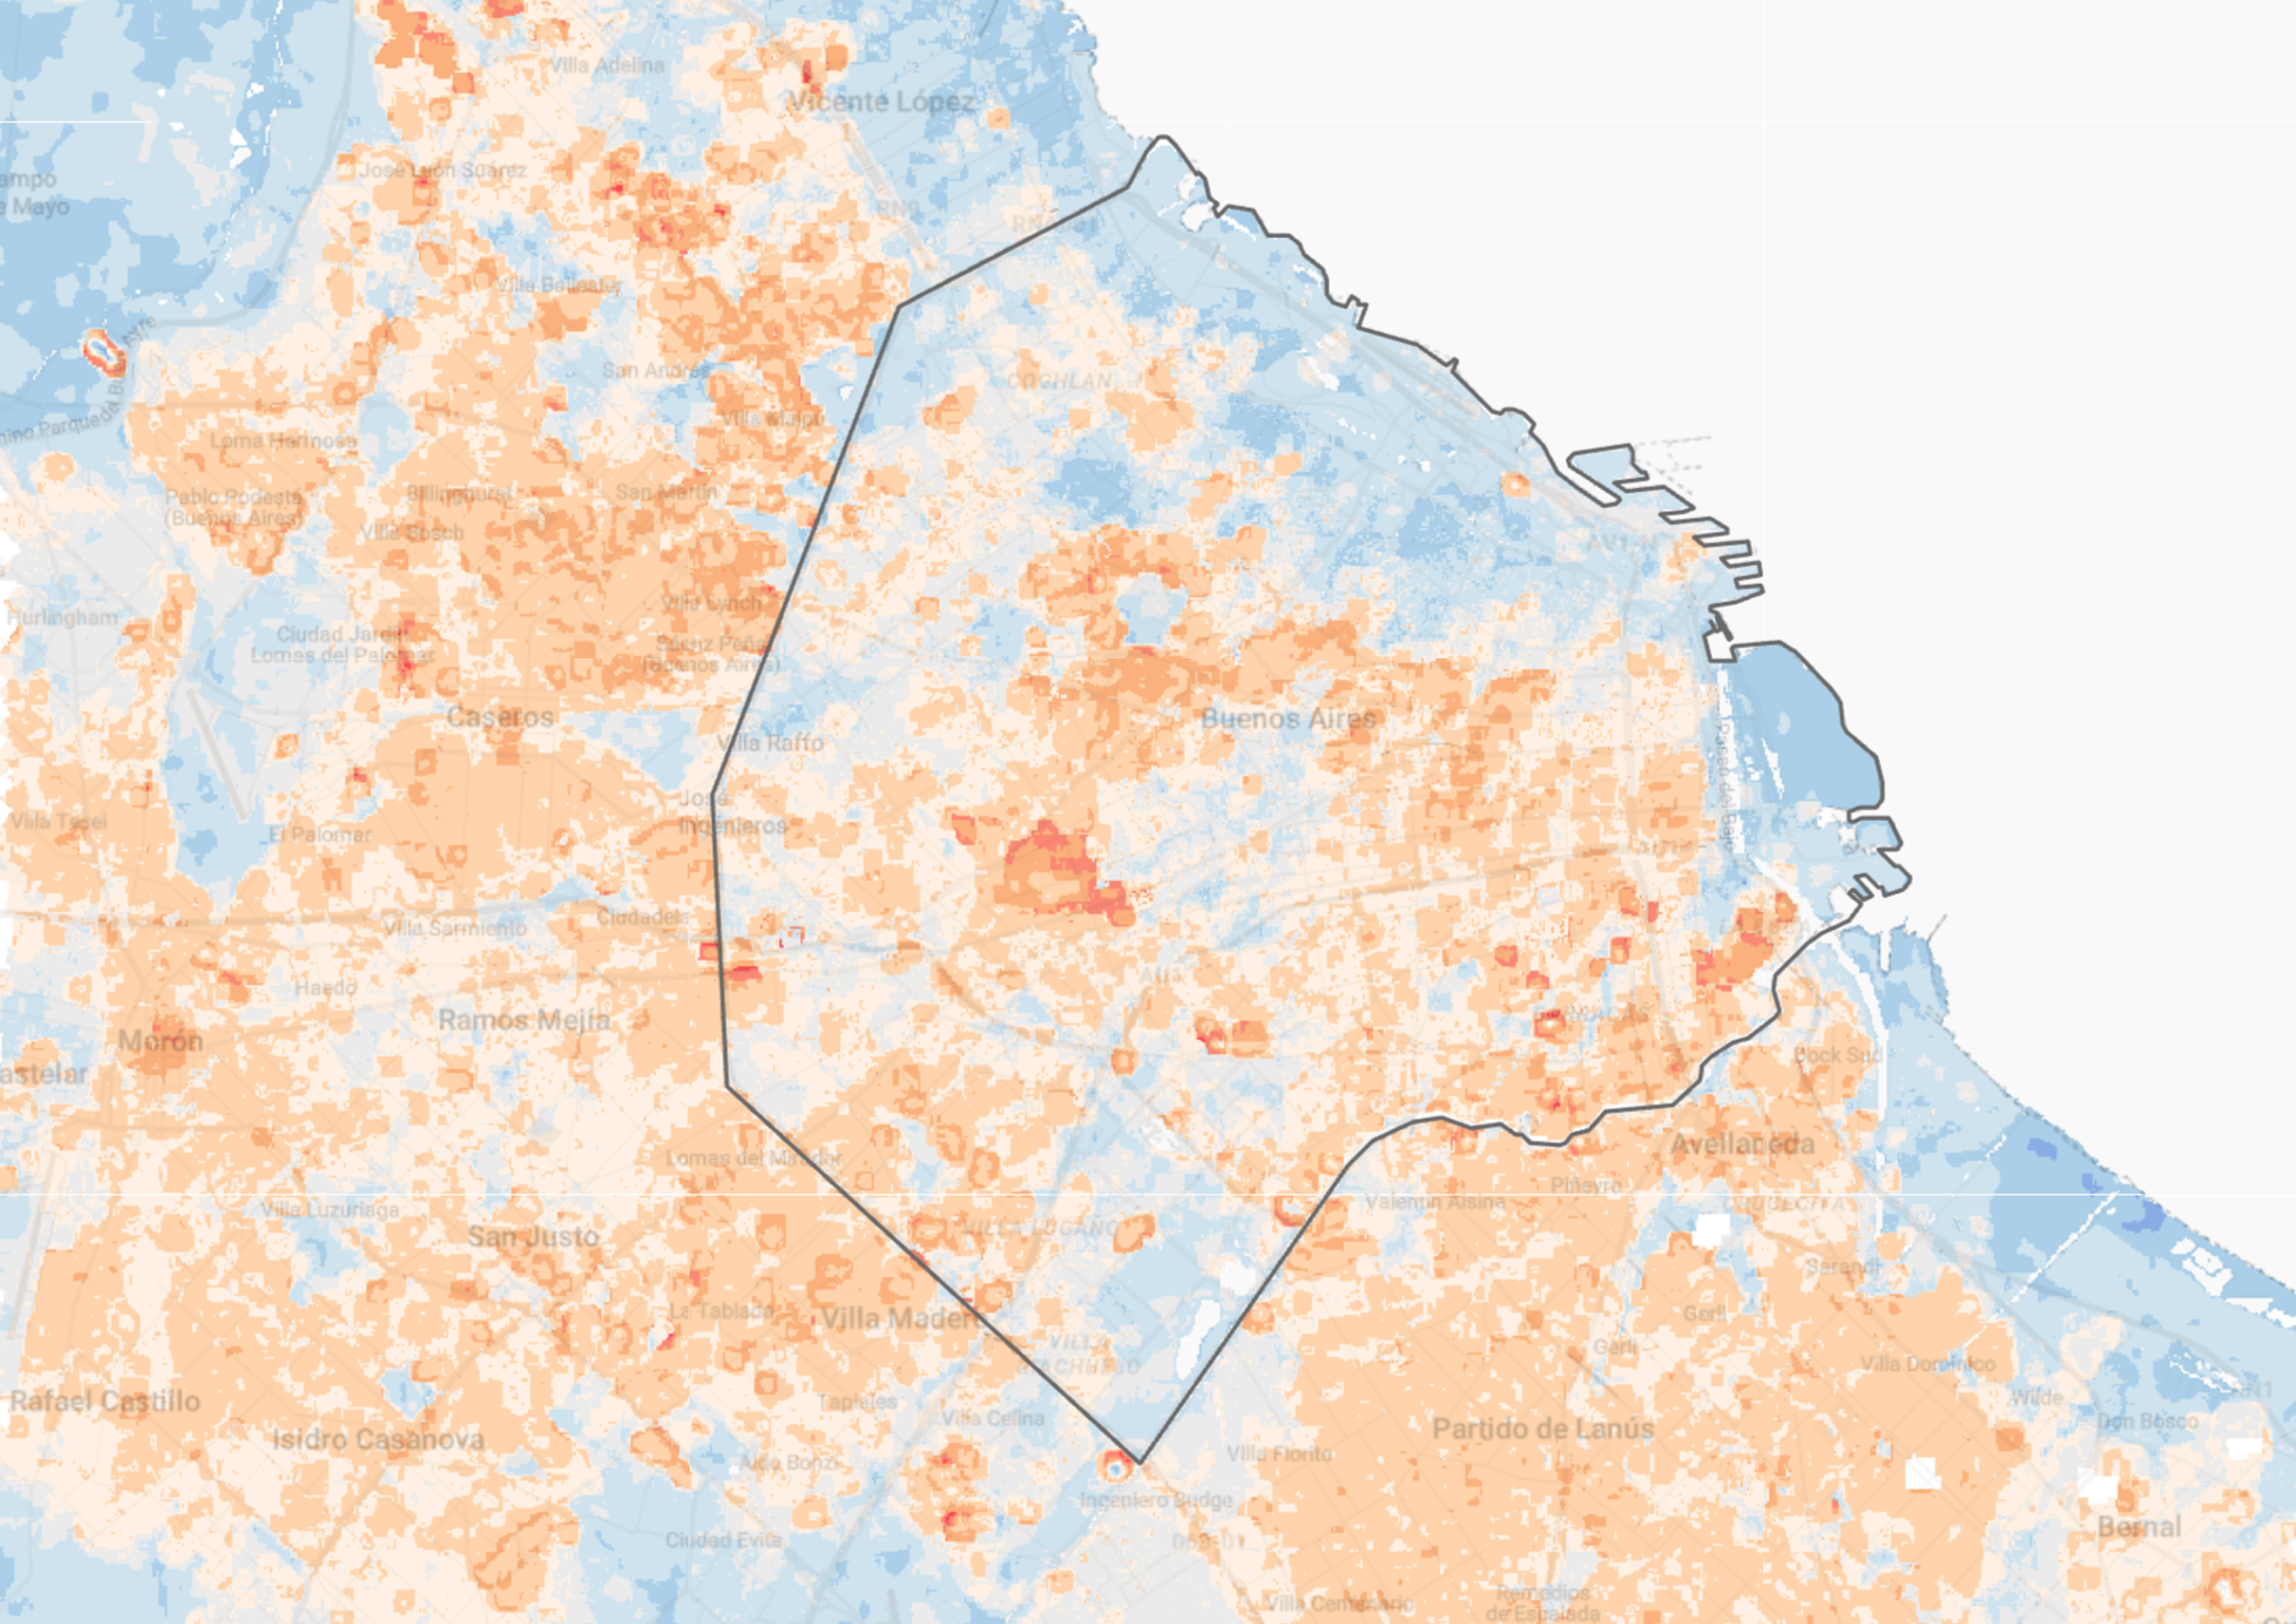
The impact of climate change is becoming increasingly evident in large cities. According to records from the National Meteorological Service, last summer in Argentina was the warmest since systematic records began in 1961, experiencing 10 heatwaves, an unprecedented phenomenon for the country. The lack of urban planning and extreme weather events —such as increasingly stifling summers and persistent droughts in Argentina— translate into a phenomenon called "urban heat islands". These are areas where the temperature is higher than the surrounding environment. In Buenos Aires, there are several urban heat islands, usually generated by a combination of extensive concrete and little vegetation or water.
In addition to discomfort, urban heat islands are critical because they impact public health and energy consumption, among other issues. Given this scenario, we combined journalistic research, data analysis, maps, and immersive visualizations to cover all aspects of the problem: what heat islands are and why they occur, their relationship with climate change, health effects, and the solutions adopted by other cities to mitigate this phenomenon.
My role
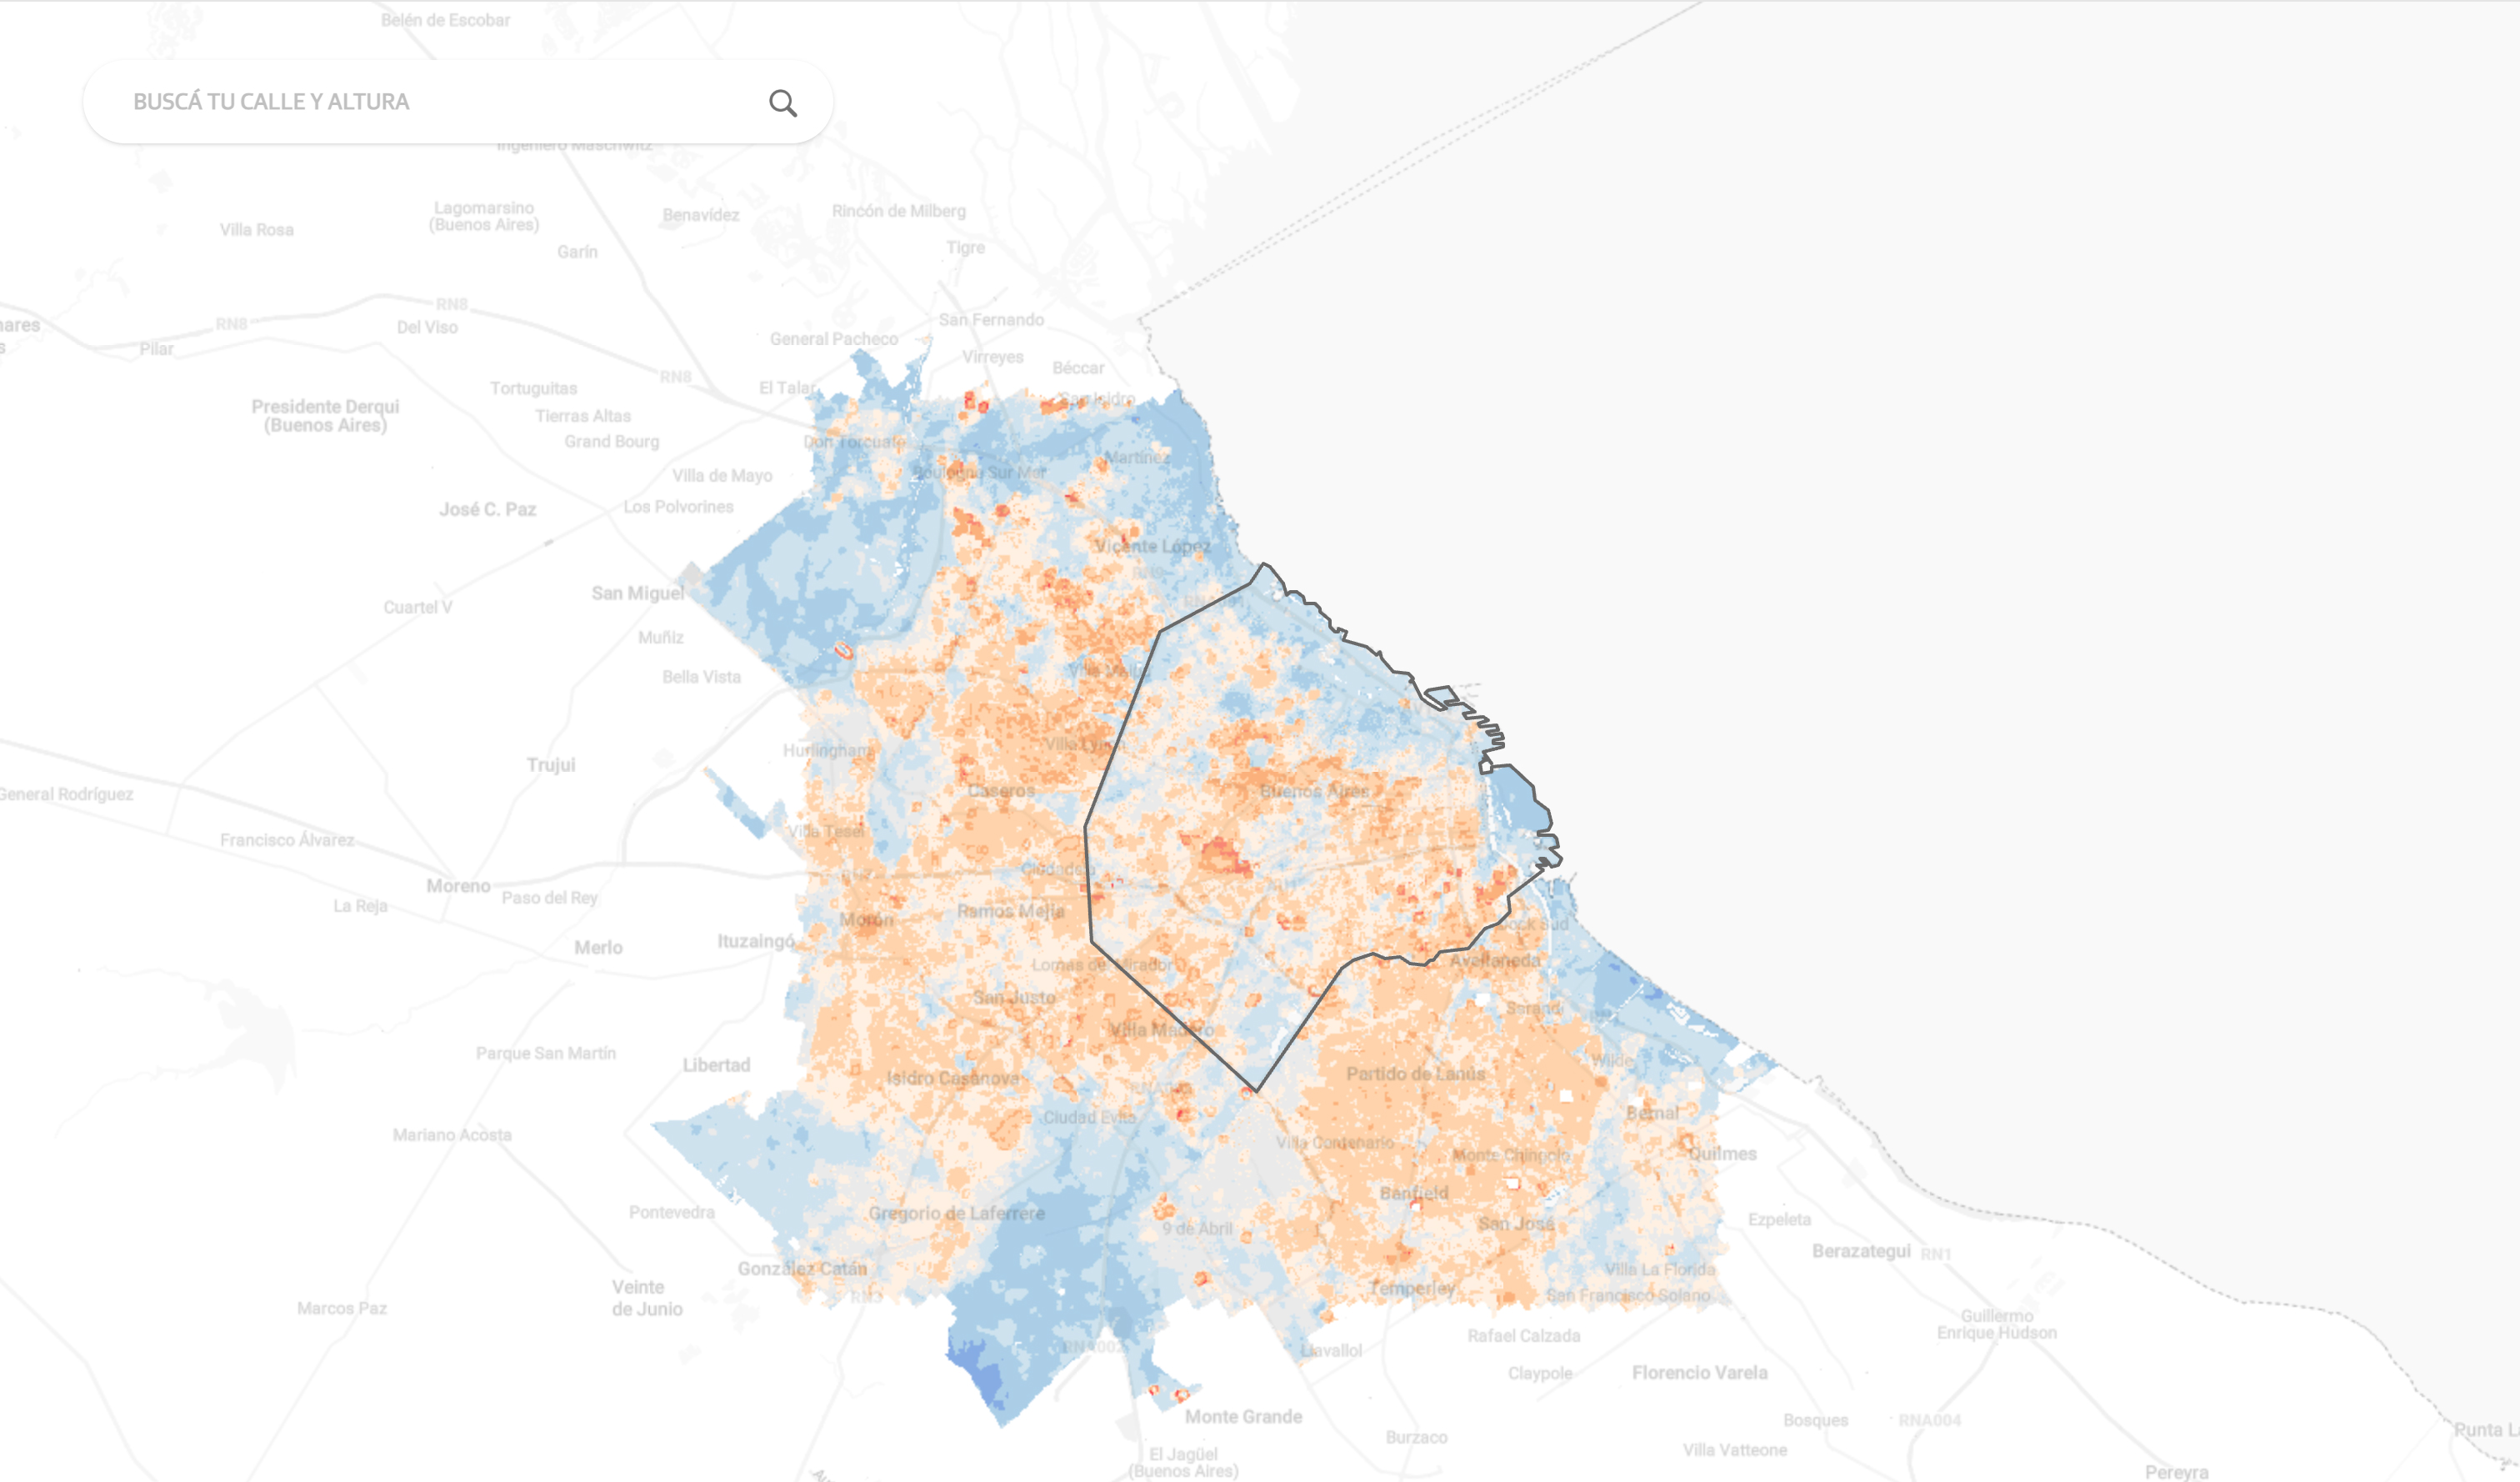
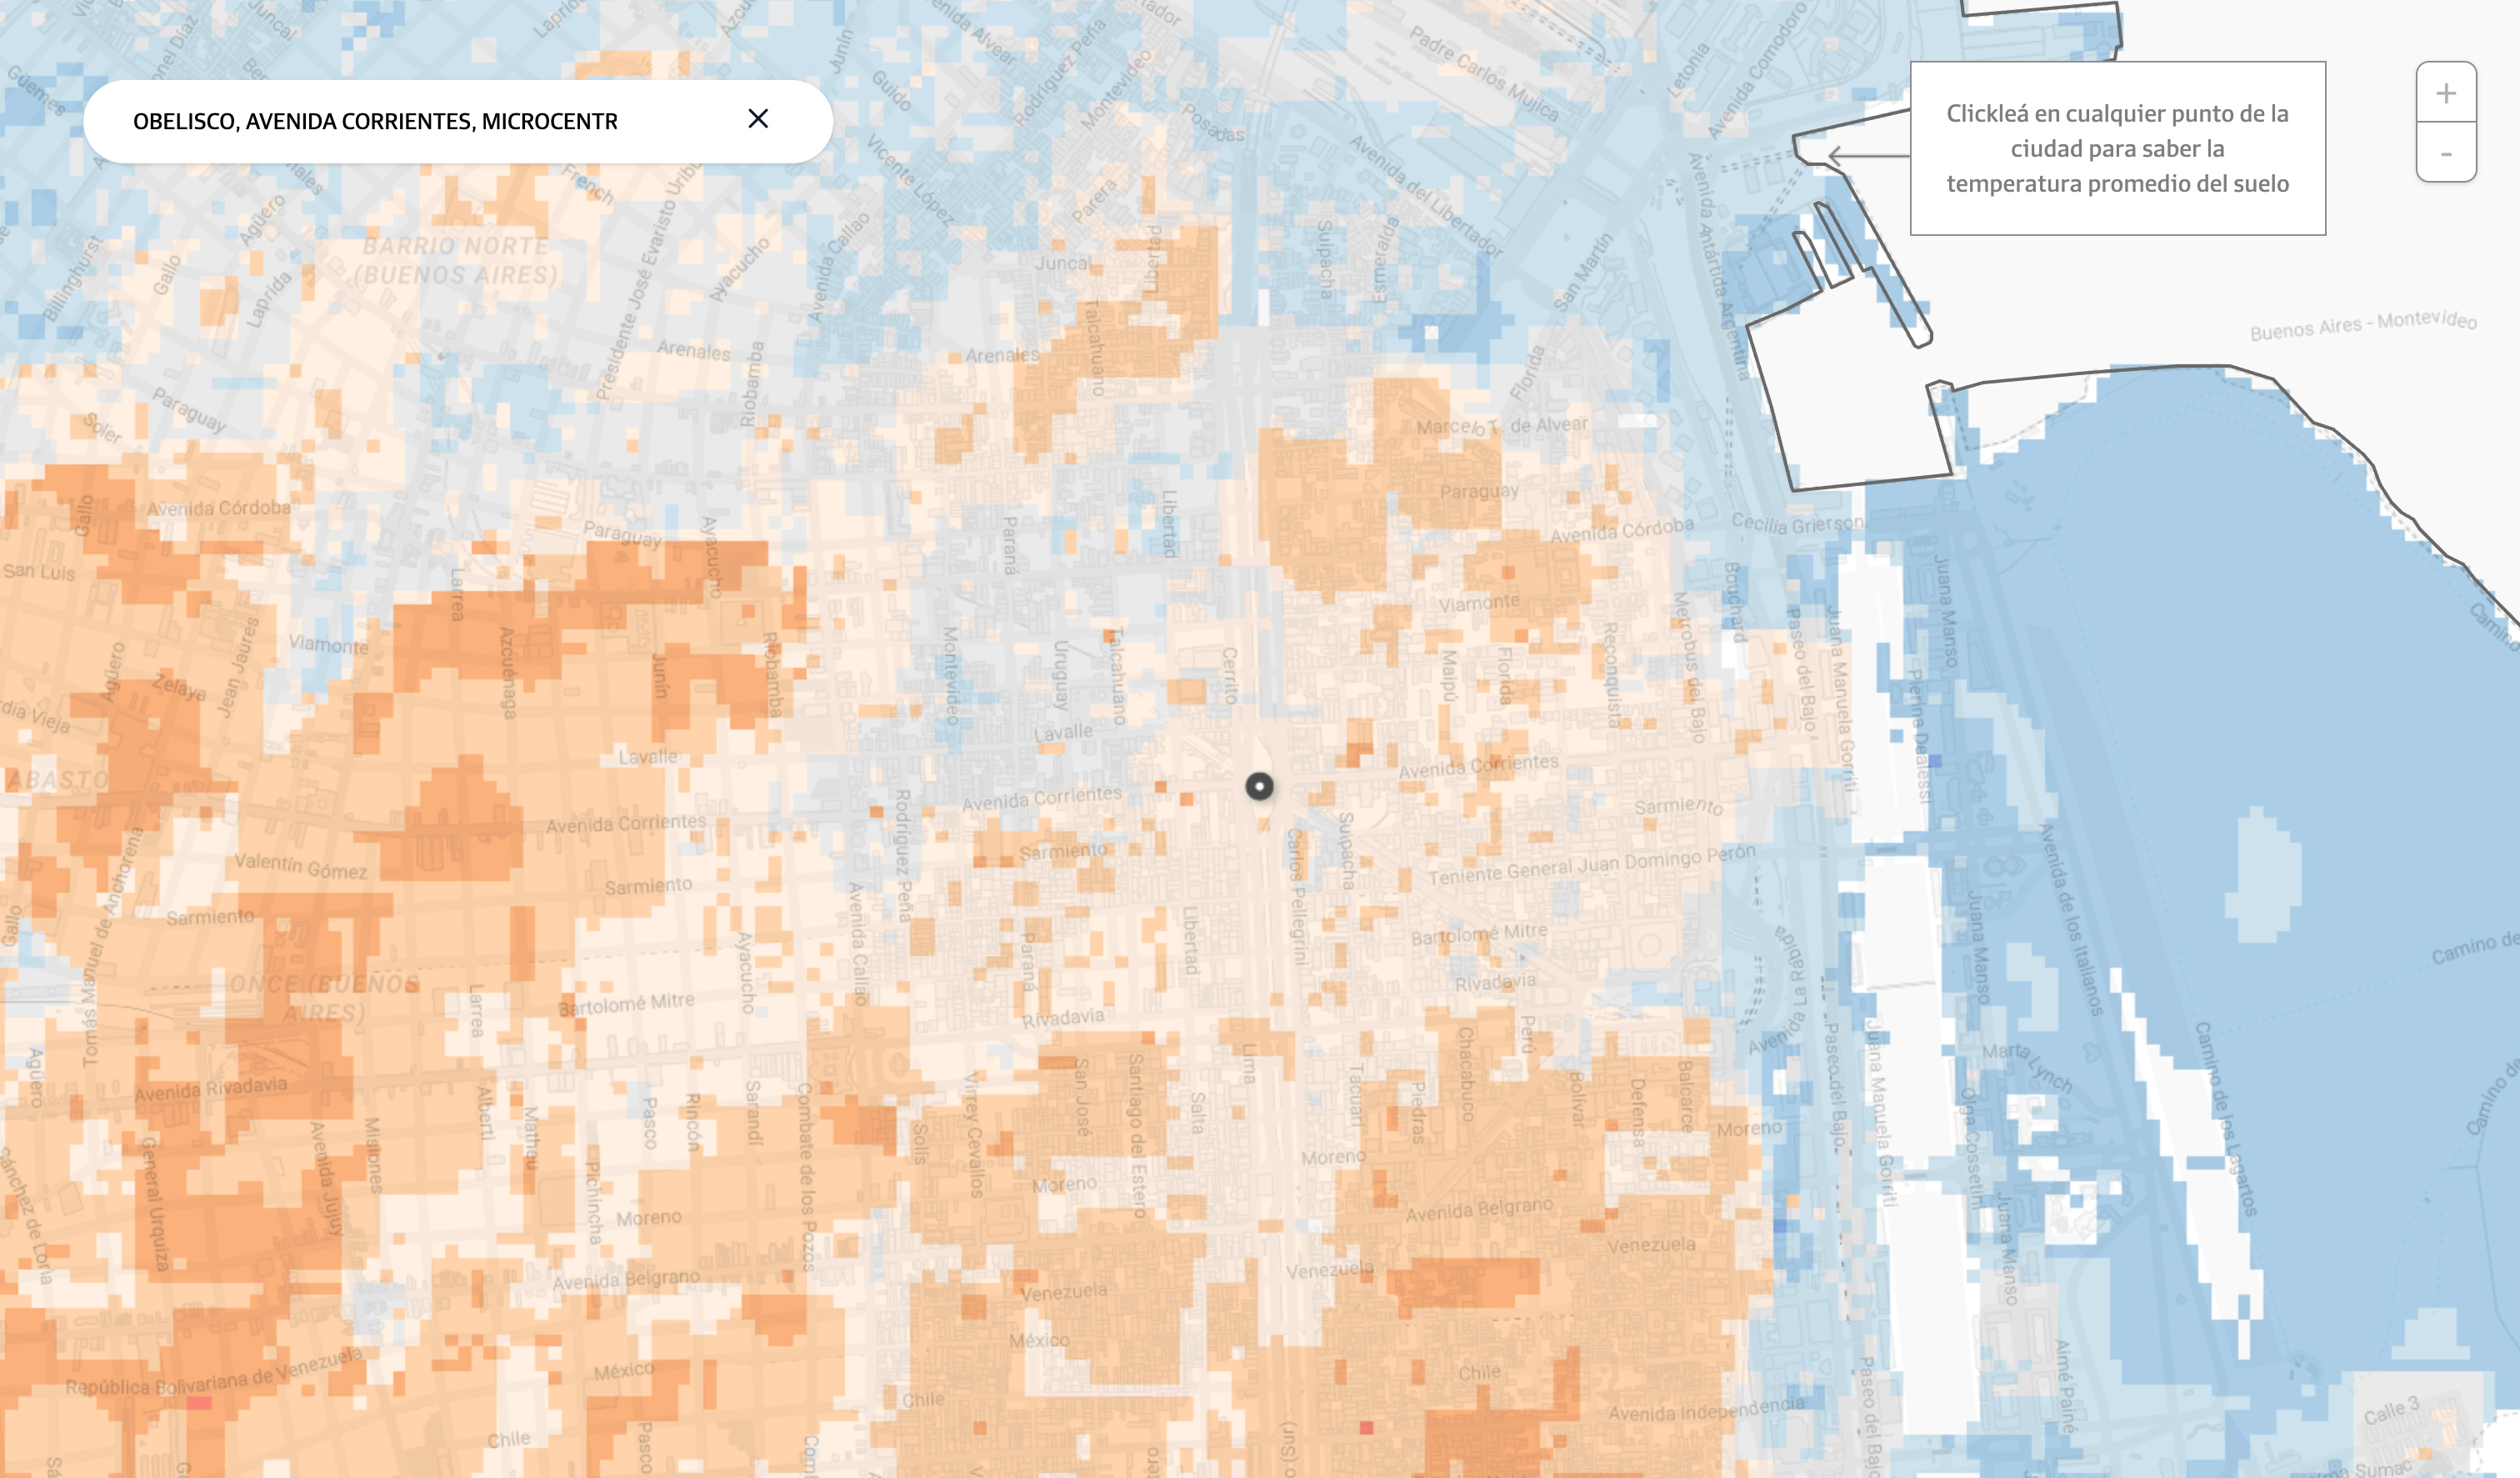
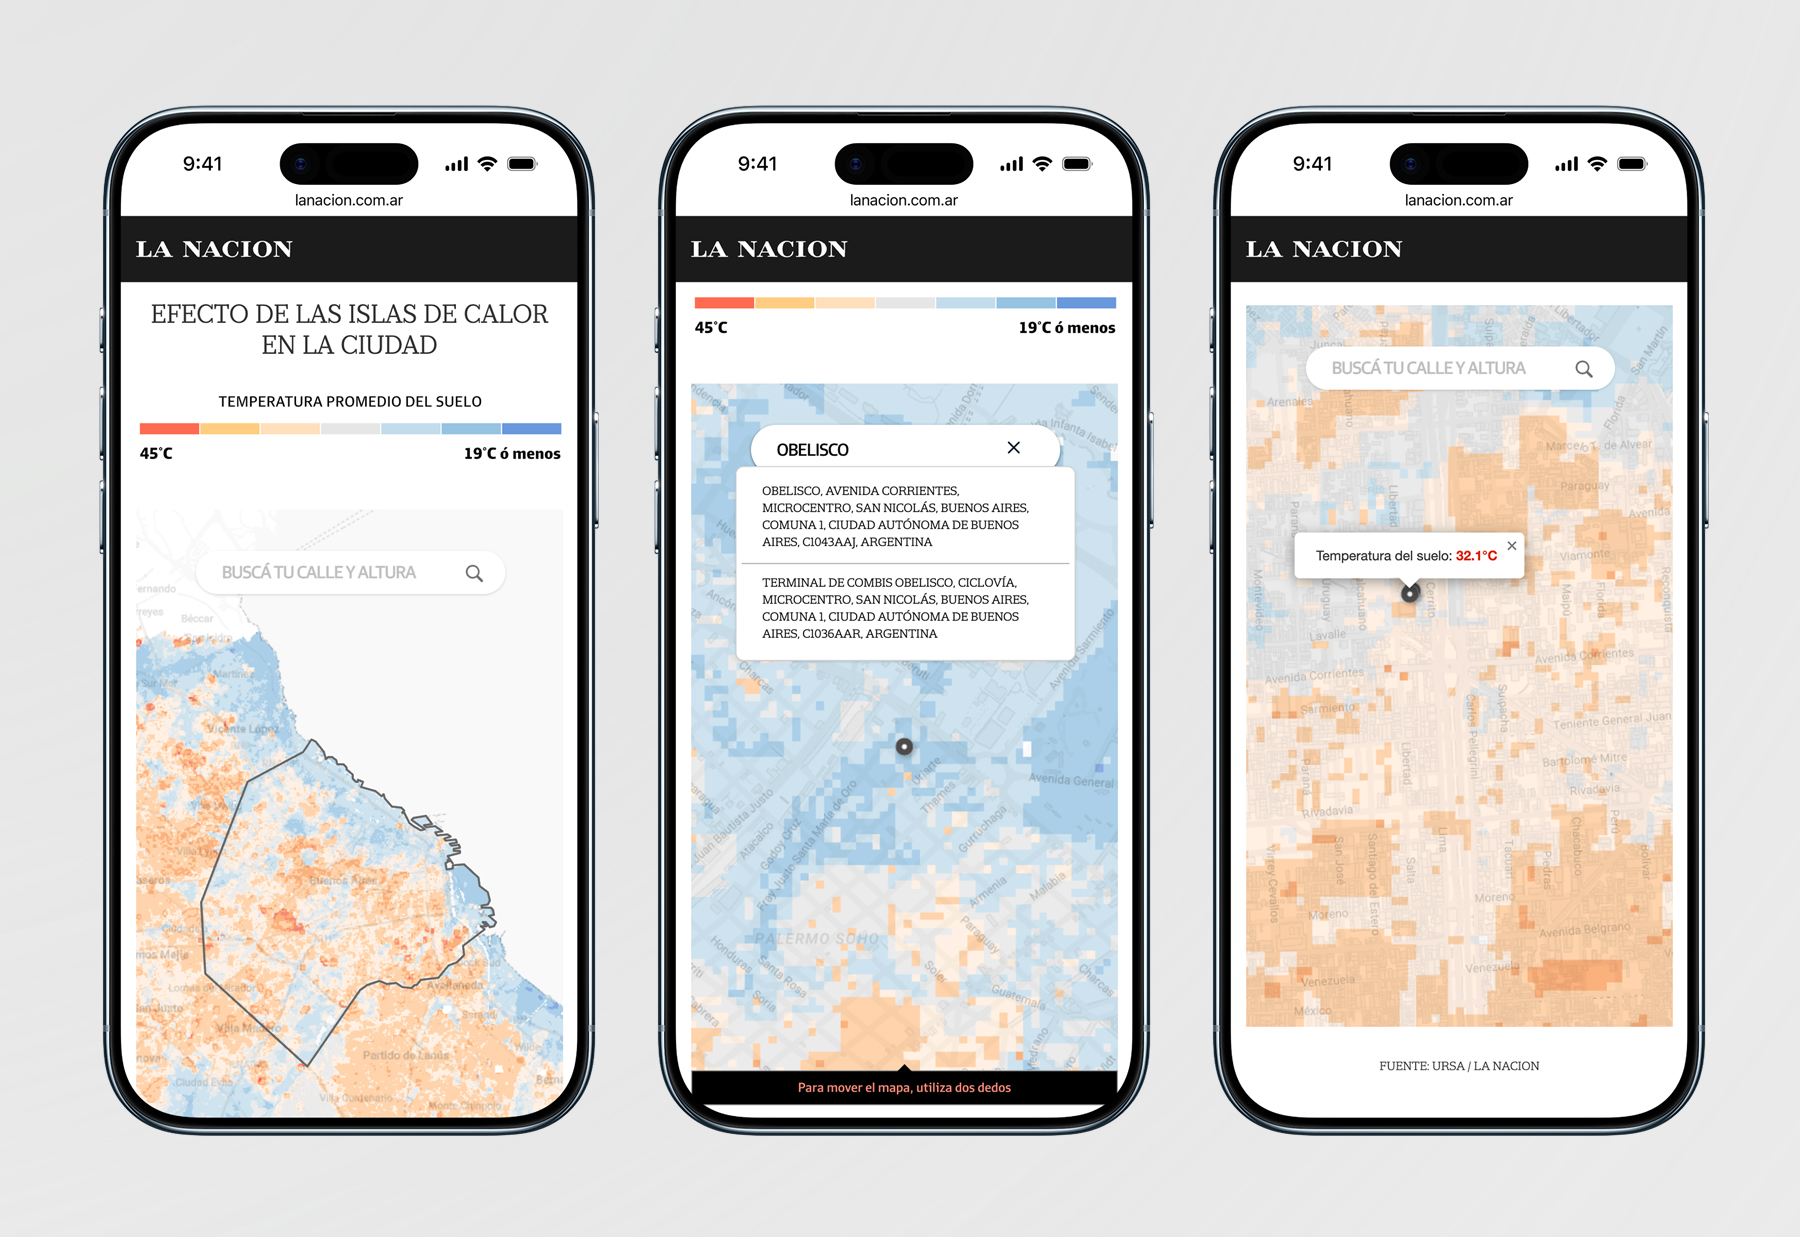
Firstly, with the backend and frontend development team we built an interactive map using data from the Urban Reporting based on Satellite Analysis (URSA) of the Inter-American Development Bank (IDB), with a street-level detail, allowing the audience to interact with the content and choose a specific point in the city, such as their home block or workplace street. This map visually presents the annual average ground temperature in different areas od the city compared to the average in rural areas. In some cases, differences of more than 20 degrees Celsius can be observed between different locations. This required the technical expertise of a data scientist and urbanist, who measured ground temperatures in 500 cities across Latin America and the Caribbean using Landsat 8 satellite images (NASA), with the Buenos Aires chapter presented in this production.
To visualize the map, we used an in-house map server developed by La Nación, in combination with open-source JavaScript libraries such as Leaflet, Geoblaze, and Georaster. These libraries enabled us to integrate URSA data with our custom tile map. Additionally, we implemented the Nominatim API to power the street search feature, allowing user inputs to interact with the map.
I also worked on implementing the animated project opening of videos, which featured animated bars as part of the visual interaction. For this, I used Svelte and D3 to build the height scales and the color transition. The videos were uploaded to JW Player, a video database, and I used the API to connect to the database and fetch the video. Additionally, I also used the Intersection Observer API to trigger the animation automatically when the video element enters the viewport as the user scrolls. We filmed the places with the highest and lowest ground temperatures for the animated opening project.